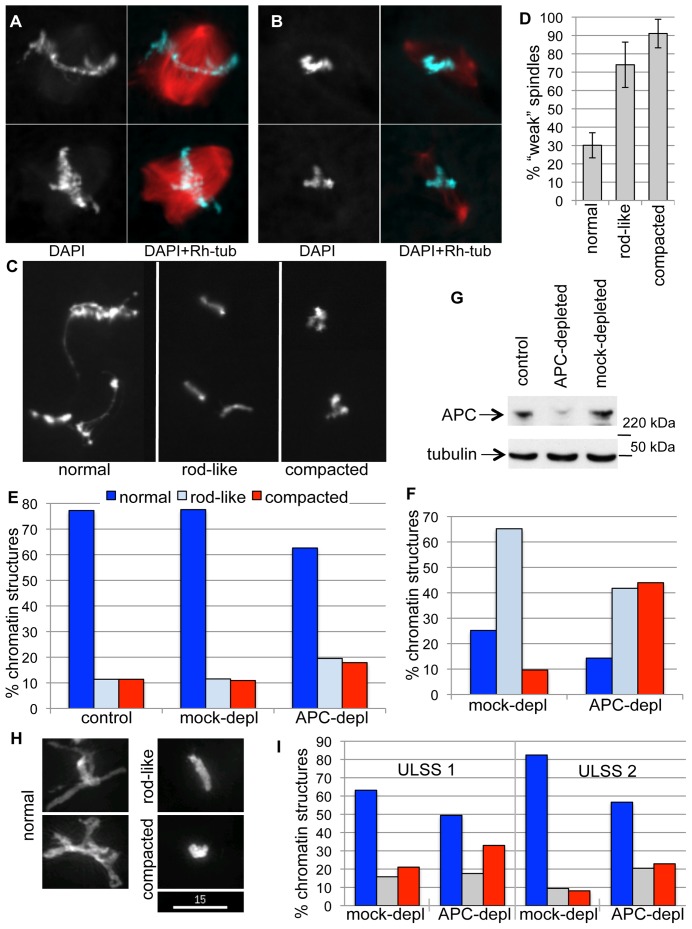
Figure 1. APC depletion changes chromatin appearance in Xenopus egg extract.
Demembranated sperm chromatin was incubated with CSF extract in the presence of a small amount of Rhodamine-labelled tubulin for 1 h, overlayed with DAPI-containing fixative and imaged. A . Two representative examples of “strong” spindles formed in such extract, with a dense microtubule network and well-resolved, mitotically condensed chromatin. B . Two representative examples of “weak” spindles formed in CSF extract with low microtubule content and abnormally compacted chromatin. C . Typical morphology of chromatin classified here as normal (left panel), rod-like (middle panel) and compacted (right panel) used for the quantification shown in D-F. D . Proportion of phenotypically “weak” spindles formed around chromatin with normal, rod-like and compacted morphology was determined in three different preparations from the same extract. Between 62 and 85 spindles per slide were counted. E . Quantification of chromatin morphology by categories depicted in C, after incubation in untreated (control), mock- or APC-depleted extracts for 1 h. 80–165 chromatin figures were scored for each condition. F . Quantification of different chromatin morphologies according to categories depicted in C, after incubation in mock- or APC-depleted extracts for 1 h, followed by exposure to +12°C. 70–90 chromatin figures were scored for each condition. G . Level of APC depletion in CSF extract visualized by immunoblotting mock- and APC-depleted extracts with anti-APC antibody. Tubulin was used as a loading control. H . Representative images of demembranated sperm chromatin after incubation in ULSS extract at 23.5°C for 50 min, classified as normal, rod-like and compacted for quantification in I. Sum intensity projections of deconvolved z-stack images capturing the total chromatin fluorescence are shown. Size bar 15 µm. I . Percent of normal, rod-like and compacted chromatin (as depicted in H) detected after incubation in mock- or APC-depleted ULSS extract after 40 (ULSS 1) or 50 (ULSS 2) min. Data from two independent experiments are shown. 74–133 chromatin figures were scored for each condition.

