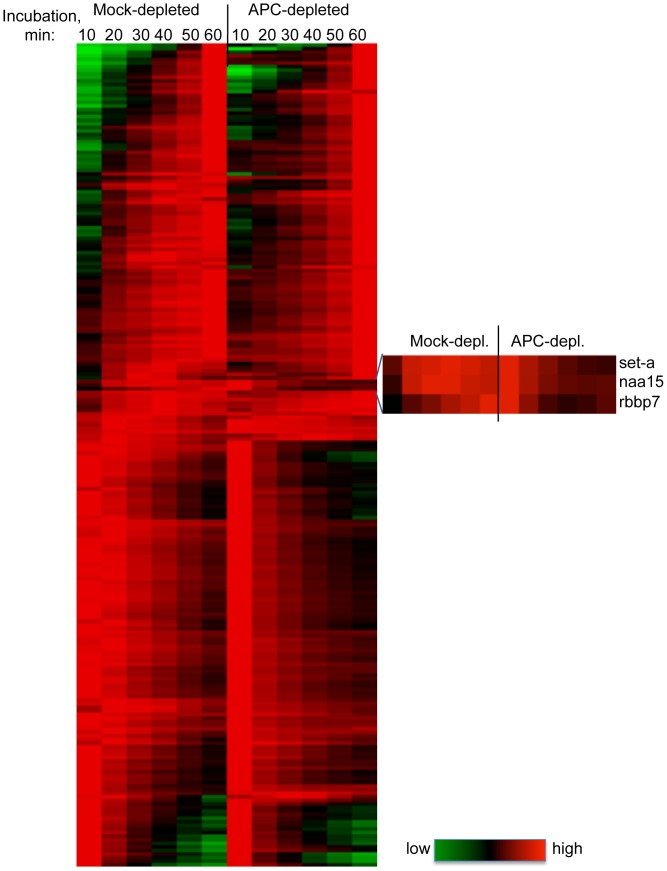
Figure 4. Temporal chromatin association profiles of proteins identified in proteomic screen in APC-depleted and control extracts.
Data from 231 protein ID’s that display similar dynamics in all eight analyses (in three independent extracts, see Fig. 3 D) were clustered using TreeView, and displayed as a heat map. Green, black and red represent low, intermediate and high signal, respectively. An enlarged insert depicts a cluster of proteins with dynamics that vary significantly after APC depletion.

