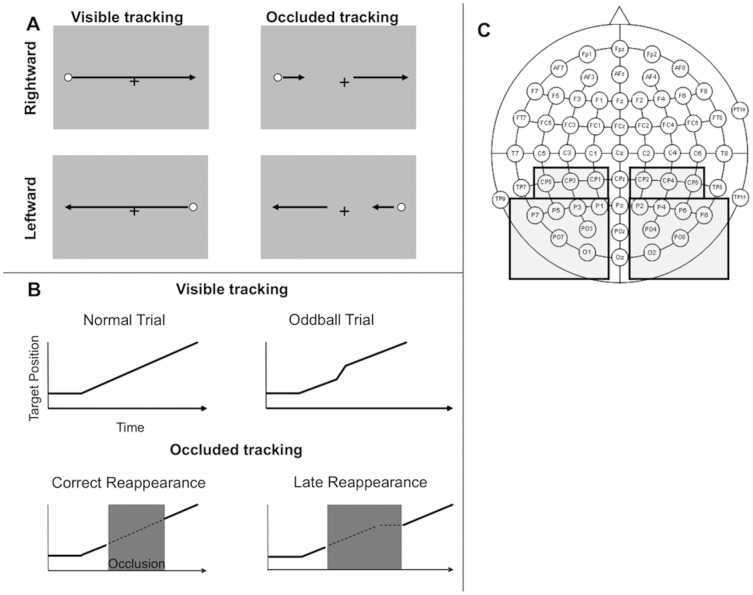
Figure 1. The Experimental Tasks and Set-up.
A) Diagram of the basic tasks. B) Upper panels: Schematic of the target position vs. time in the Visible Task. Lower panels: schematic of target position vs. time in the Occluded Tracking Task. C) The layout of scalp electrodes. Grey shaded regions show the left and right clusters that were used for all analysis.

