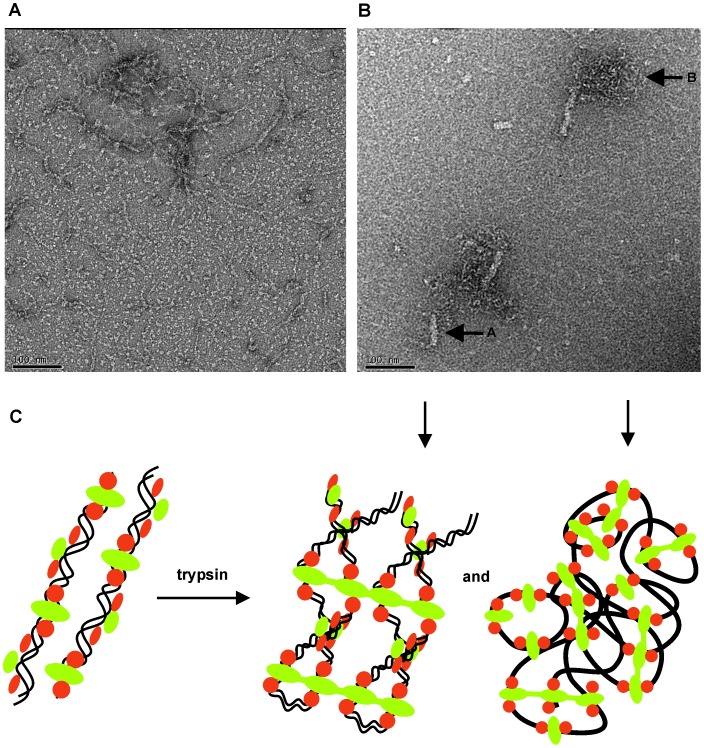
Figure 6. Negatively stained Lsr2/DNA complexes visualized by transmission electron microscopy show large morphological changes upon trypsin treatment.
(A) Lsr2 co-purified with E. coli genomic DNA; (B) Lsr2 after trypsin digestion (1∶500 ratio) for 30 minutes; Arrows A and B point to condensed structures commonly seen during the trypsin digestion time series. (Scale bars = 100 nm); (C) A cartoon representation of protein oligomerization and DNA compaction after trypsin digestion. Lsr2 N-terminal dimerization domain is depicted in green and the C-terminal DNA-binding domain is depicted in orange. The downward pointing arrows correlate the features in (B) with their cartoon representations in (C).

