
Figure 3. CpG methylation across the Thra promoter region (see Results section) in CTL (C) and FOL (F) adult male rats as measured by pyrosequencing analysis.
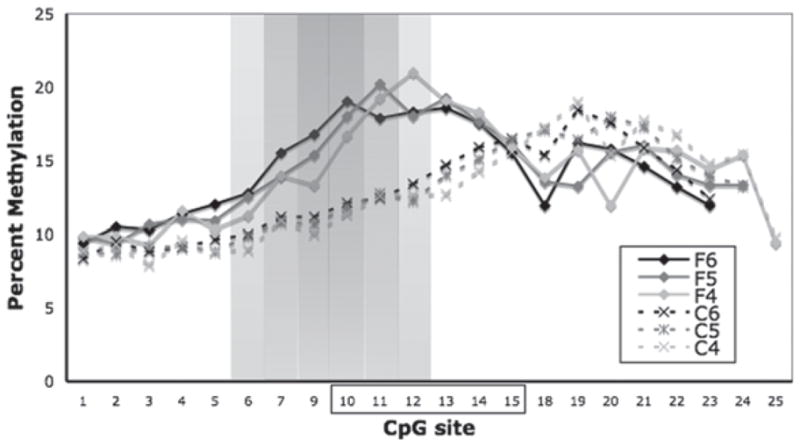
Regional enhancement of methylation (sites 10–15, boxed) was determined following post hoc analysis between groups using a sliding window approach with window sizes of four to six CpGs (e.g. C4 vs. F4) as shown. Percent methylation for each window is plotted at the first CpG of that window. Shading indicates significance (P < 0.05) for a single (light) to all three (dark) window sizes starting at a given CpG site.