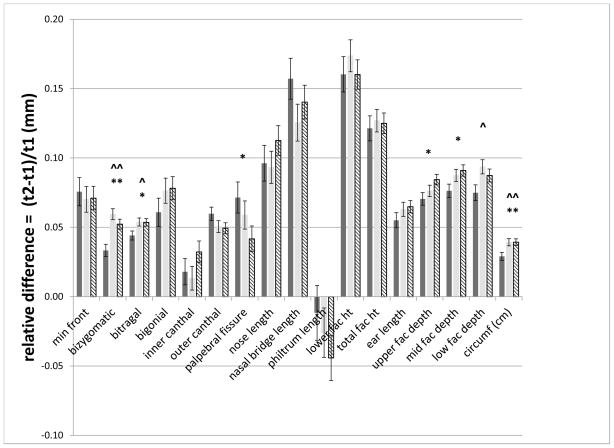
Figure 3. Significant differences in relative growth of anthropometric measures across the groups.
Mean and standard error bars for relative differences of all measures. Solid dark bar: FAS/PFAS; Solid light bar: HE; Hatched bar: C. ^^ = FAS/PFAS vs HE p ≤ 0.0001; ^ = FAS/PFAS vs HE p ≤ 0.05; ** = FAS/PFAS vs C p ≤ 0.0001; * = FAS/PFAS vs C p ≤ 0.0

