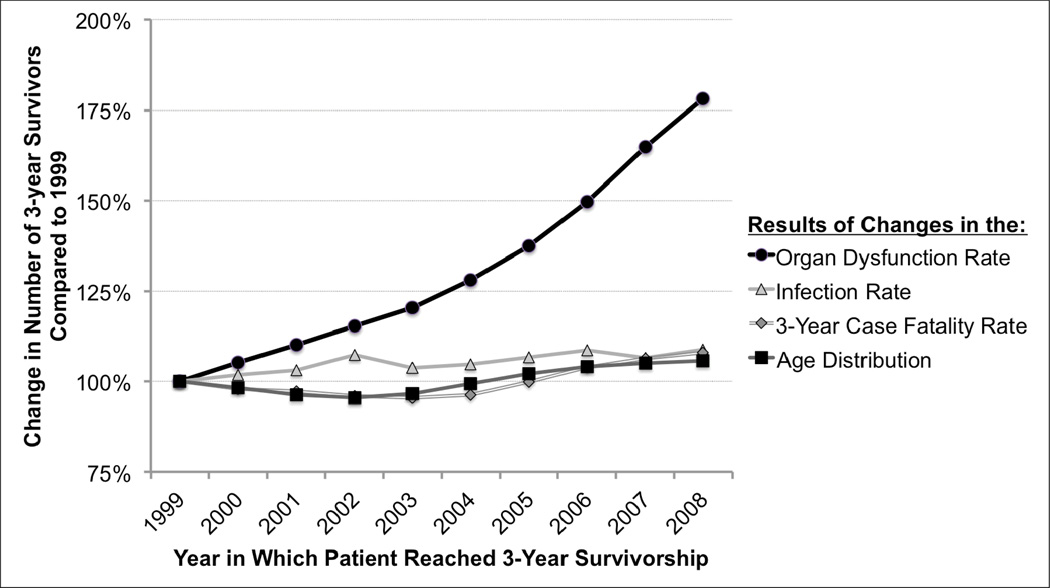
Figure 4.
Contributions to the Rising Number of Survivors of Severe Sepsis. This Figure shows the relative number of 3-year survivors who would have been expected had only each given factor changed.
Interpretive Example: The aging of the population alone would have resulted in a 5.7% increase in the number of 3-year survivors between 1999 and 2008, had other rates remained the same. The Figure reveals that the most important contributor to the growth in the number of severe sepsis survivors over this decade was the increase in the rate of organ dysfunction per patient hospitalized with infection, not by better survival among patients with severe sepsis.

