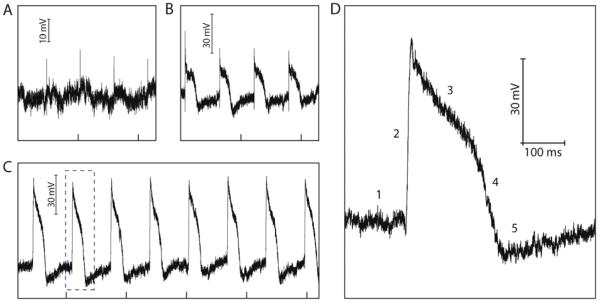
Figure 3. Action potential recording with ANTT probes.
(A) Representative potential vs. time data recorded immediately following contact between the ANTT probe and a single cardiomyocyte. (B) Representative potential vs. time data recorded ca. 100 s following contact between the ANTT probe and a single cardiomyocyte and the trace in A. (C) Stable potential vs. time data recorded ca. 5 min following trace B. The tick marks in A-C correspond to 1 s. (D) Zoom of the single intracellular action potential peak in trace C highlighted with the dashed box. The five characteristic phases of the action potential peak, denoted by 1-5, are defined in text. In all the traces, the recorded device conductance was calibrated with the measured water-gate sensitivity to yield the plotted voltage signal.

