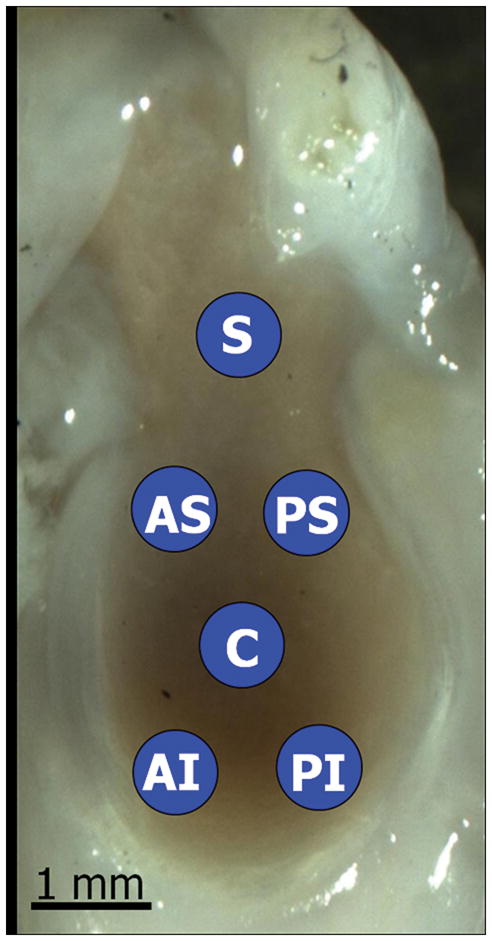
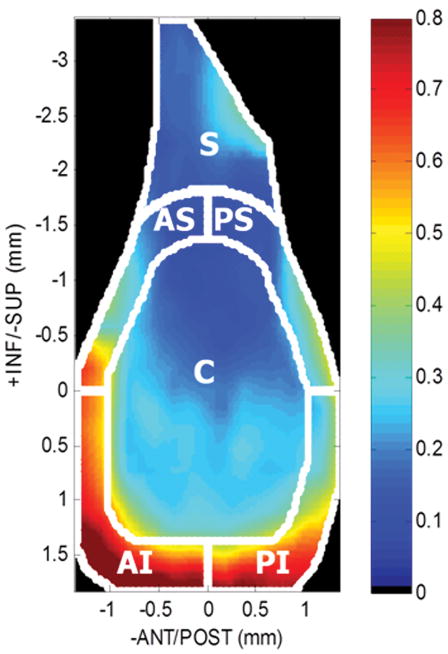
Figure 2.

Figure 2A: Sagittal view of a representative cartilage thickness map determined by ultrasound and divided into six regions (center (C), antero-superior (AS), antero-inferior (AI), postero-superior (PS), postero-inferior (PI), and superior (S)).
Figure 2B: Saggital view of a representative image of the rat glenoid, highlighting the six locations for mechanical indentation testing. Cartilage thickness was calculated at each location using ultrasound.

