
Figure 3.
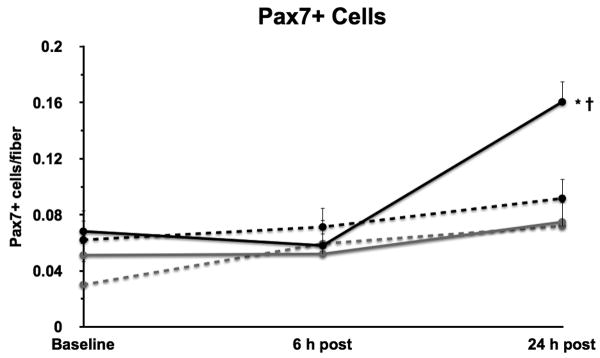
The number of Pax7+ cells at baseline and at 6 and 24 h post resistance exercise in young (black lines) and older (grey lines) men (solid lines) and women (dashed lines). *Different from baseline, P ≤ 0.006. †Different from all groups at 24 h, P ≤ 0.006.