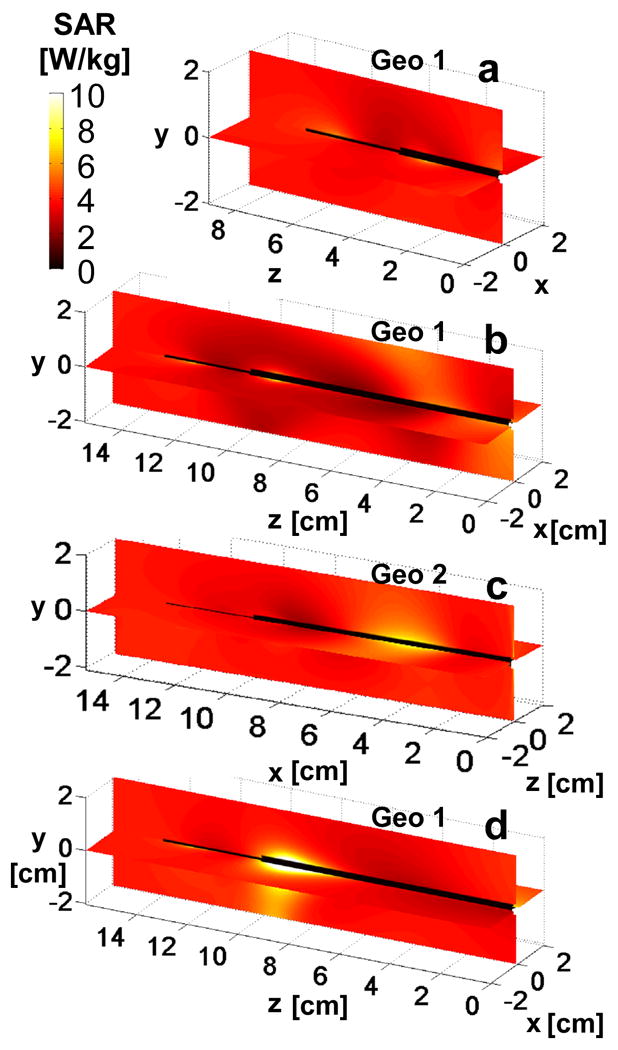
Figure 6.

The computed 1-g average SAR normalized to 4W/kg applied local SAR is shown on the coronal and sagittal antenna planes at 7T for insertion depths of (a)35 mm, and (b,c)100 mm. Part (d) shows the SAR computation for 3T with a 100mm insertion depth. Part (c) is the distribution in geometry 2 and parts (a,b,d) are in geometry 1. Axes on (a-d) denote position in [cm].
