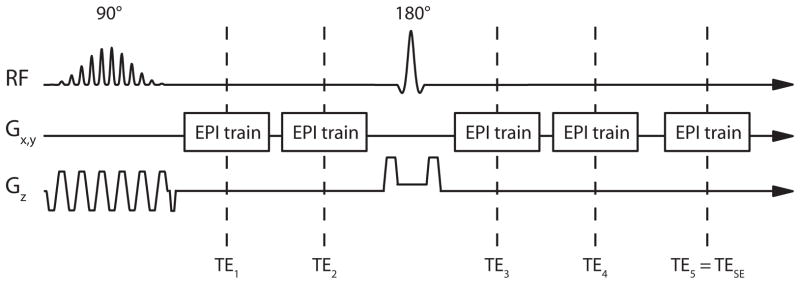
Fig. 1.
Pulse sequence diagram of SAGE EPI pulse sequence: a spectral-spatial signal excitation pulse is followed by two EPI readout trains acquired at echo timesTE1 and TE2, a 180° refocusing pulse, and three more EPI readouts (TE3–TE5), with the last readout at TE5 = TESE resulting in a SE signal.

