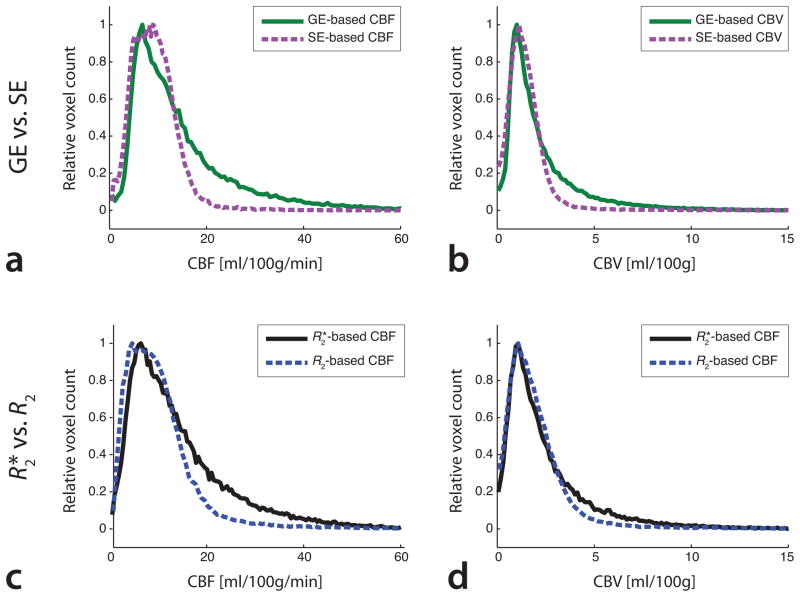
Fig. 5.
Histograms of (a, c) CBF and (b, d) CBV values for the patient shown in Fig. 4, processed using (a, b) single-echo data and (c, d) multi-echo data. In absence of substantial BBB-leakage, the histograms showed similarities between GE-and R2*-based DSC-PWI data, as well as between SE-and R2-based data. The narrower SE-and R2-based distributions of CBF and CBV confirmed a decreased sensitivity to larger blood vessels.

