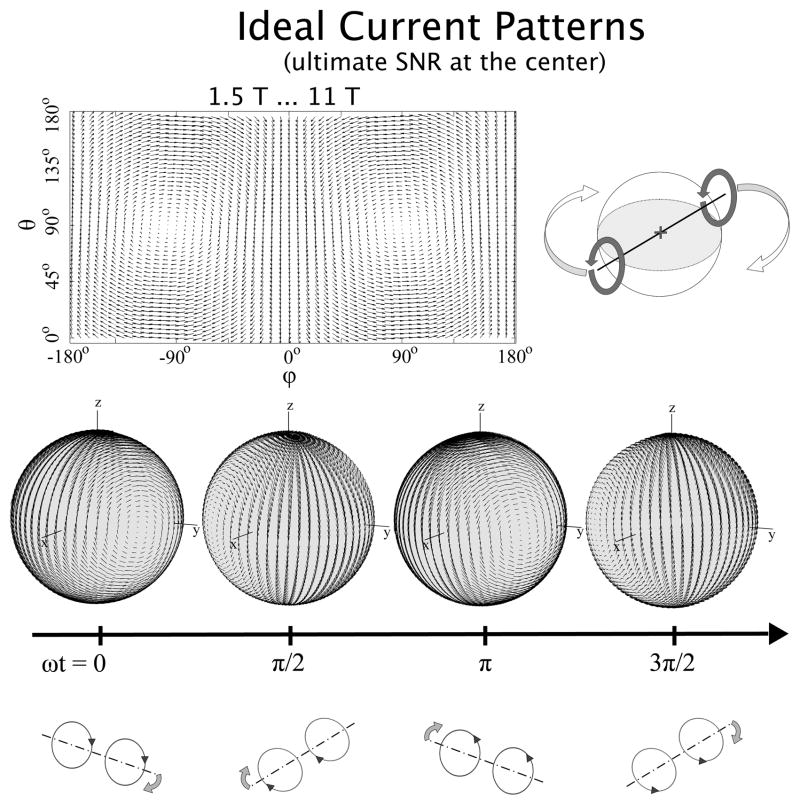
Fig. 4.
Ideal surface current patterns associated with the best possible SNR at a voxel in the center of the sphere. On the left-hand side of the top row, current patterns are plotted for an arbitrary time point on a two-dimensional “unwrapped” view of the spherical surface, whereas on the right-hand side, a schematic representation shows how the current patterns evolve in time (via the harmonic time dependence e−iωt). In the middle and bottom rows, three-dimensional representations and explanatory diagrams of the current patterns are shown for four time points, respectively. For all simulated field strengths (1.5 T to 11 T), ideal currents patterns for a voxel in the center take the form of two distributed loops on opposite sides of the sphere, which rotate in the same sense about an axis that precesses around the z-axis.

