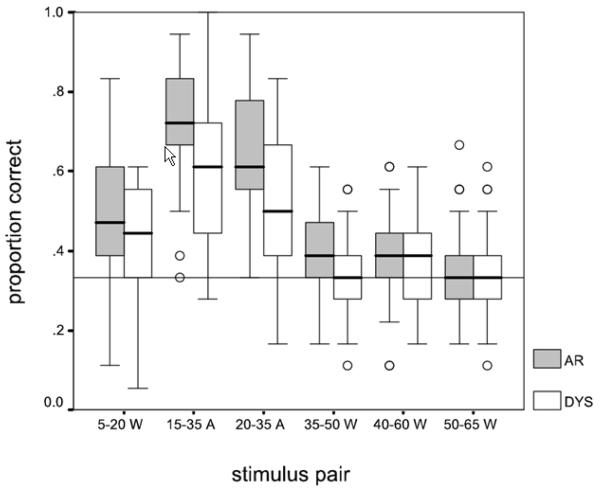
Figure 4.
Box plot of the proportion of correct discrimination scores for each pair of stimuli presented using the fixed procedure (FixedAC-Q and FixedWC-Q). The DYS children are represented in white boxes, and the AR children are represented in gray boxes. The horizontal line represents chance level of performance, which is set at .33 proportion correct in this task. FixedAC-Q = fixed presentation discrimination task: across-category stimulus pairs; Fixed WC-Q = fixed presentation discrimination task: within-category stimulus pairs.

