
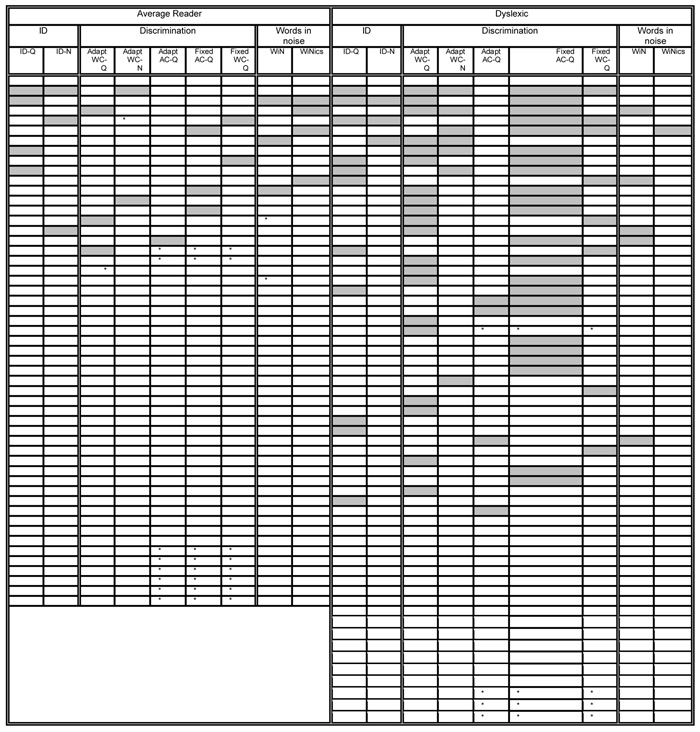
Table 4.
Poor and good perceivers in each task presented individually for the 51 average reading children and the 62 children with dyslexia: each row represent a listener, grey cells represent scores within the ‘below norm’ range, empty cells represent score within the normal range, * represents scores that could not be collected.
|