
Figure 2.
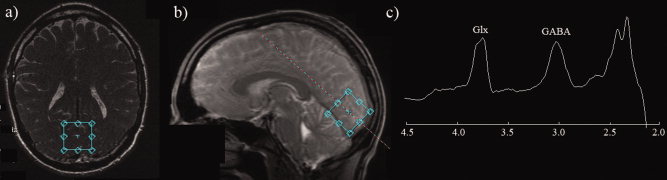
(a,b) Typical location of the 3 × 3 × 3 cm spectroscopy voxel for oblique‐axial and sagittal slices placed on the localiser scan (c) A typical GABA‐edited spectrum obtained from a single acquisition/participant (two spectra were obtained for each participant). A clearly resolved GABA peak is evident at 3 ppm. [Color figure can be viewed in the online issue, which is available at wileyonlinelibrary.com.]