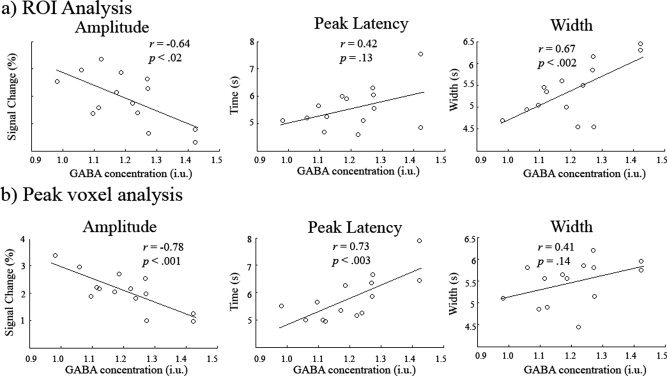
Figure 4.

Scatter plots showing the correlation of HRF amplitude, peak latency and width (FWHM of the peak) with GABA concentration for the ROI analysis (a) and for the peak voxel (b). In both cases amplitude was negatively correlated with GABA concentration. Confidence intervals for the r values can be found in the Results.
