
Figure 6.
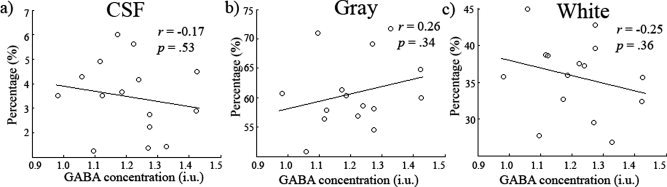
(a–c) Scatter plots showing GABA concentration (i.u) against CSF, gray and white matter respectively. No relationship was found between any of the tissue types and GABA concentration. Confidence intervals for the r values can be found in the results.