
Figure 7.
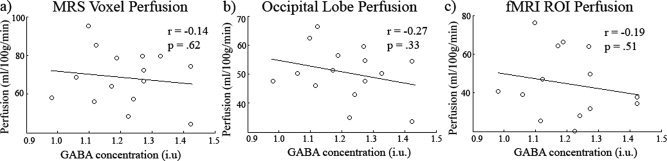
Scatter plot showing GABA versus (a) MRS voxel gray matter perfusion, (b) occipital lobe gray matter perfusion, and (c) fMRI ROI gray matter. No significant relationships were found. See text for confidence intervals of the r values. The perfusion measures were intercorrelated.