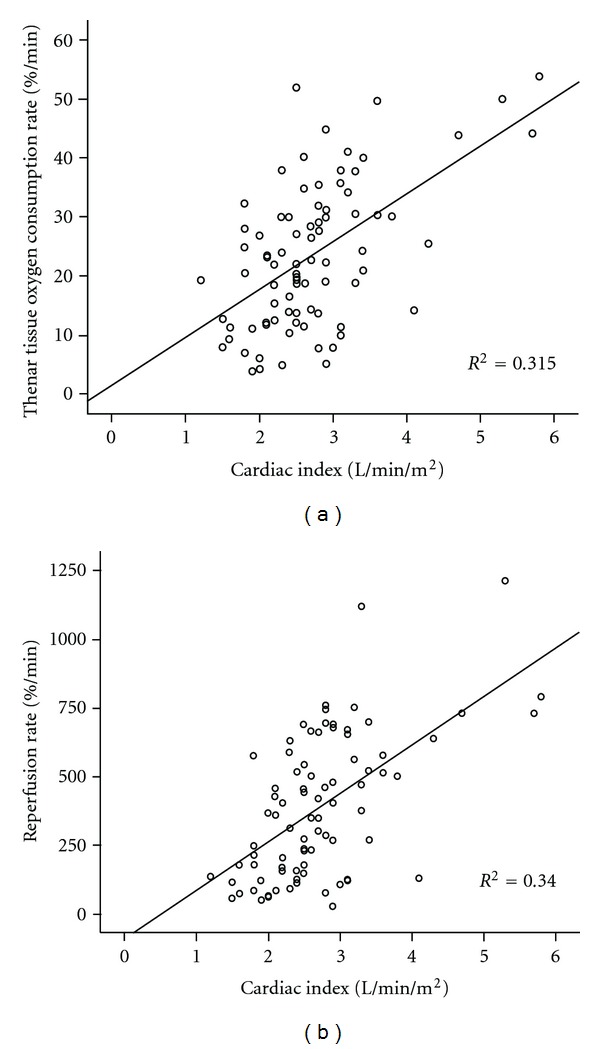
Figure 1.

(a) Scattergram of the thenar tissue O2 consumption rate (%/min) during a 3 min vascular occlusion technique and cardiac index (L/min/m2, r = 0.56, P < 0.001, n = 82) for pooled data. (b) Scattergram of the reperfusion rate (%/min), indicative of the endothelial function after cuff release following a 3 min vascular occlusion technique and cardiac index (L/min/m2, r = 0.58, P < 0.001, n = 82) for pooled data.
