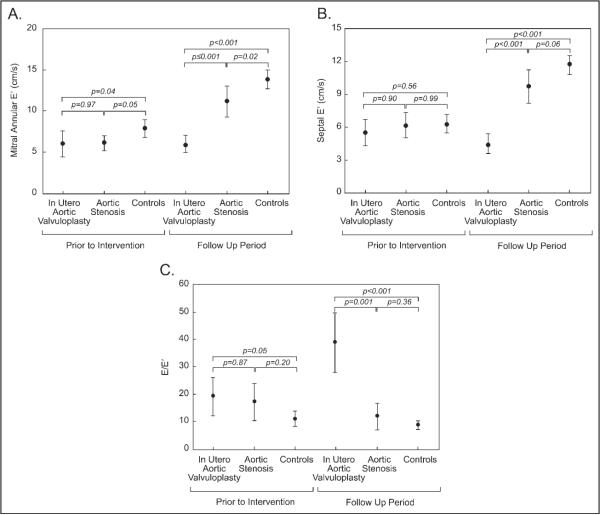
Figure 1.
Error bar plots comparing mean diastolic properties (central dots) and 95% confidence interval (whiskers) among groups in the neonatal period and follow-up period. (A) Mitral annular early diastolic tissue velocity Doppler (before intervention p = 0.01, follow-up period p <0.001, analysis of variance). (B) Septal early diastolic tissue velocity (before intervention p = 0.18, follow-up period p <0.001, analysis of variance). (C) Early diastolic mitral inflow velocity/early diastolic tissue velocity (before intervention p = 0.05, follow-up period p <0.001, analysis of variance). The p values in the diagram represent post hoc pairwise comparisons with Bonferroni correction or Tamhane test.

