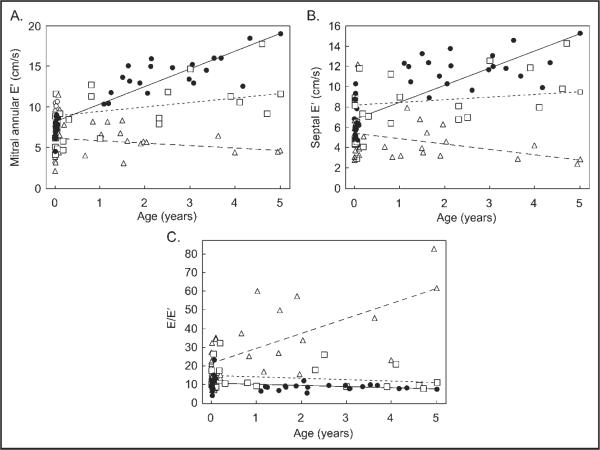
Figure 2.
Scatter plots showing tissue Doppler imaging diastolic variable versus age in controls (circles), patients with fetal aortic valvuloplasty (triangles), and patients with aortic stenosis (squares). (A) Mitral annular early diastolic tissue velocity. (B) Septal early diastolic tissue velocity. (C) Early diastolic mitral inflow velocity/early diastolic tissue velocity. A generalized estimating equation regression line (straight lines) was determined for each group. For each plot the slope of the line representing patients with fetal aortic valvuloplasty differed (p <0.01) from patients with aortic stenosis and controls.

