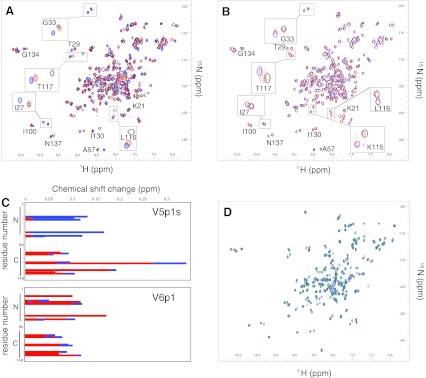
Fig. 2.
Overlaid 15N-1H-HSQC CaM-peptide NMR spectra and data analysis. Five to ten contours were deliberately spaced closely to allow for proper overlaying of the spectra and emphasis of the changes. a CaM-V5p1s spectra at CaM:V5p1s 1:0 (black), 1:1 (red) and 1:2 (blue) molar ratio. b CaM-V6p1 spectra at CaM:V6p1 1:0 (black), 1:1 (red) and 1:2 (blue) molar ratio. c Chemical shifts induced by the peptide as a function of CaM residue number at CaM-peptide 1:1 (red) and 1:2 (blue) molar ratio. d CaM-V5p1s (dark blue) and CaM-V6p1 (teal) spectra at 1:2 CaM:peptide molar ratio

