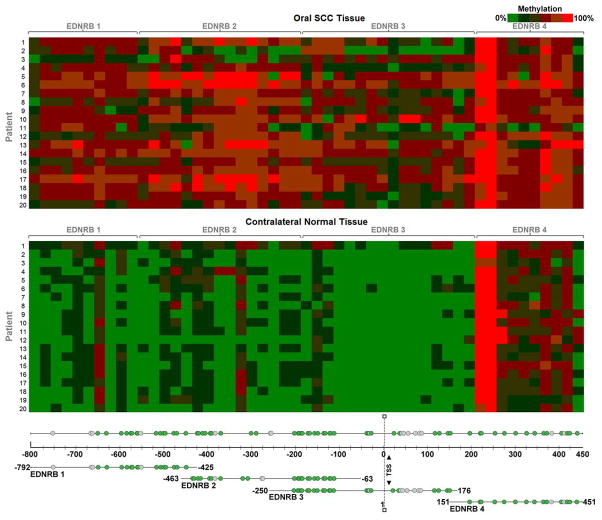
Figure 1. Heat map of EDNRB methylation.
The heat map signifies quantified methylation values. Within each cell is the methylation value of a patient sample at a particular CpG unit. The values are color coded using a green-red scale, where green is low methylation and red is high methylation. The top heat map shows methylation values of oral SCC tissue. The bottom heat map shows methylation values of contralateral normal tissue. The EDNRB PCR product in which the CpG unit is located is indicated in the gene map. Each PCR product is shown in relation to the EDNRB promoter region and exon 1. Start and end bases for each product are noted; bases are numbered relative to the transcription start site (TSS). PCR product EDNRB 1 surveys the extreme 5′ end of the CpG island. EDNRB 2 and 3 are located proximal to the TSS. They overlap each other by 188 bases. EDNRB 4 is located in exon 1 of the gene. Green circles denote the 61 out of 77 CpG sites whose methylation frequencies were quantified. Grey circles denote the 16 CpG sites that were not quantified.

