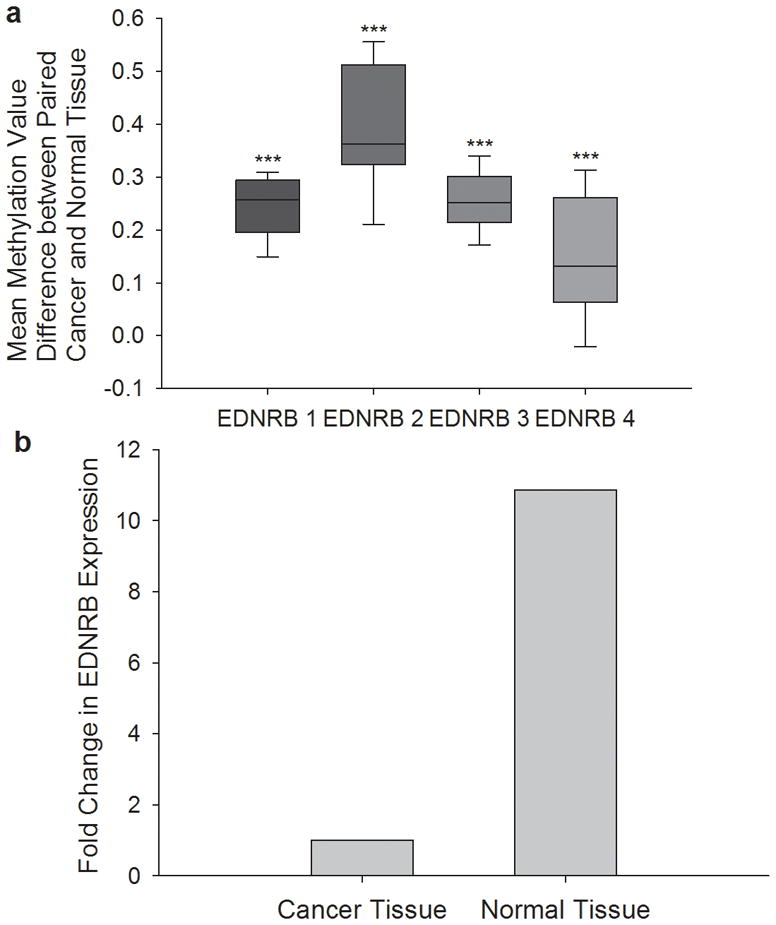
Figure 2.

(a) CpG sites have increased methylation in oral SCC tissue compared to normal tissue The box plots represent methylation difference values between oral SCC and normal tissue from the same patient. The difference values are averaged from all patients within each CpG site. All CpG sites within a PCR product are grouped together; the median, 10th, 25th, 75th, and 90th percentiles are shown for each group. PCR product EDNRB 2 has the highest increase in methylation in oral SCC tissue (median = 0.34, 34%). EDNRB 1 and 3 have a median increase of 0.25 (25%). EDNRB 4 has the smallest increase of 0.13 (13%). Methylation values for each sample are averaged across all CpG sites within each PCR product and oral SCC tissue is compared to normal tissue using the Mann Whitney Rank Sum Test (***p<.001). (b) EDNRB mRNA expression is lower in oral SCC than normal tissue. EDNRB mRNA expression in normal and oral SCC tissue was quantified using RT-PCR. GUSB was used as the internal locus control. The relative EDNRB mRNA levels was obtained using delta-delta Ct. When compared to oral SCC tissue, normal contralateral tissue has on average 10.9 times more EDNRB mRNA than oral SCC tissue (Student’s t test, p > .001).
