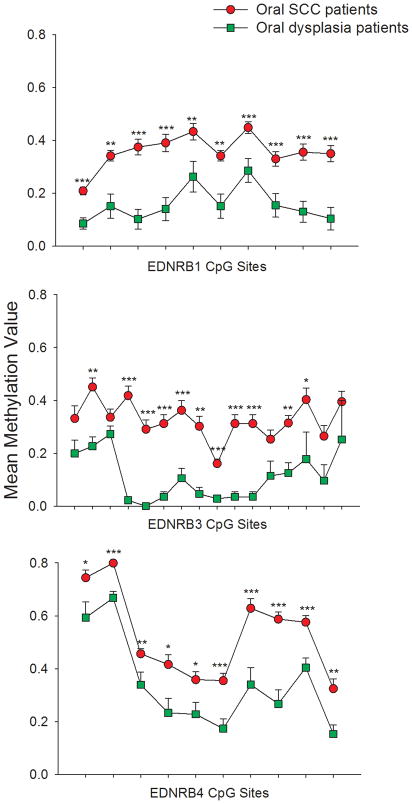
Figure 3. Oral SCC patients demonstrate higher EDNRB methylation than oral dysplasia patients.
The three plots show methylation values of CpG sites from PCR products EDNRB 1,3, and 4, respectively, in oral SCC and oral dysplasia tissues. Oral SCC tissues exhibit an average of 20% higher methylation than oral dysplasia tissues at all CpG sites. The Mann Whitney Rank Sum Test is used to demonstrate significant differences in methylation between oral SCC and dysplasia tissues (*p < .05, **p < .01, ***p < .001).

