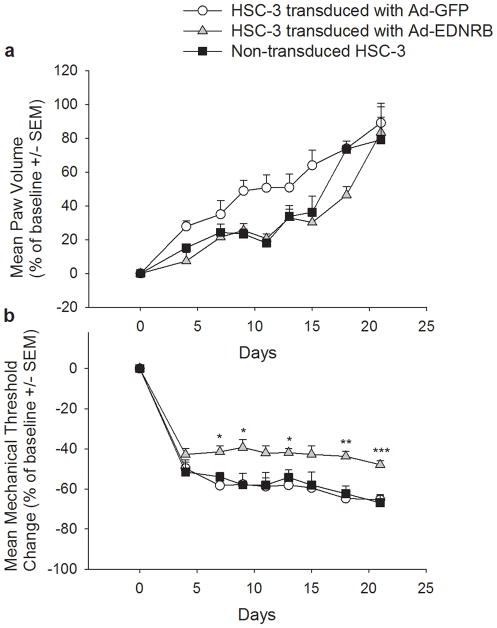
Figure 7.
(a) Ad-EDNRB transduction does not alter oral SCC tumor growth The graph shows change in paw volume, which is a measure of tumor growth. The X axis shows the days of the experiment, and the Y axis shows the average change in paw volume. All three study groups show a similar increase in paw volume as the experiment progresses. There is no statistically significant difference in paw volumes among the study groups. Standard error bars are shown, (b) Ad-EDNRB transduction decreases mechanical allodynia. The graph shows change in paw withdrawal threshold, which is a measure of mechanical allodynia. Mice with tumors that have been transduced with Ad-EDNRB exhibit significantly higher paw withdrawal thresholds, indicating lower mechanical allodynia. ANOVA and Holm-Sidak tests are used (*p < .05,**p < .01, ***p< .001). Standard error bars are shown.

