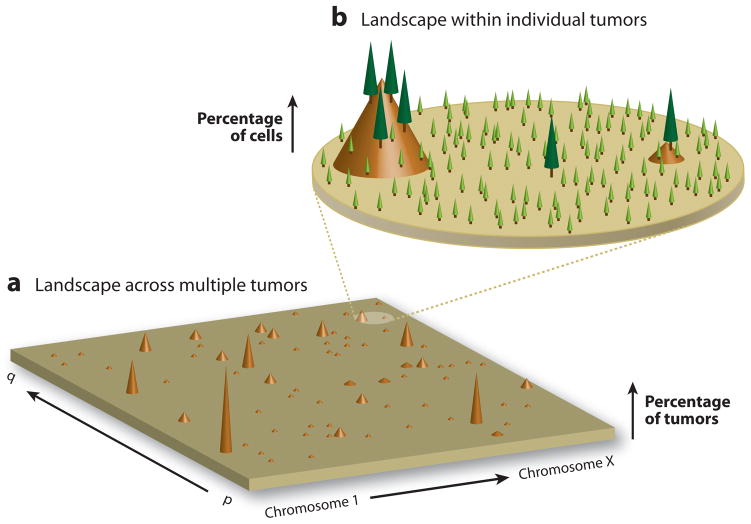
Figure 6. The mutational landscape of the cancer genome.
A) The cancer genome landscape proposed by Wood et. al. (88) graphically represents the mutational heterogeneity among different tumors of a single cancer type. The height of each brown peak indicates the percentage of tumors found to carry a clonal mutation in a particular gene. The landscape comprises a small number of “mountains”–genes which are clonally mutated in a large fraction of individual cancers–and a significantly greater number of “hills” – genes clonally mutated in only one or a few tumors. While there may be 50 or more genes clonally mutated within the genome of an individual tumor, most genes are rarely mutated in more than a few tumors. B) An additional level of the mutational landscape exists within individual tumors due to differences among the genomes of single tumor cells. Although a small number of mutations are clonally present in the majority of cells in an individual tumor (“trees”), an exponentially larger number exist subclonally in only one or a few cells (“seedlings”). Among this vast reservoir of non-clonal mutations exists many therapy-resistant variants.

