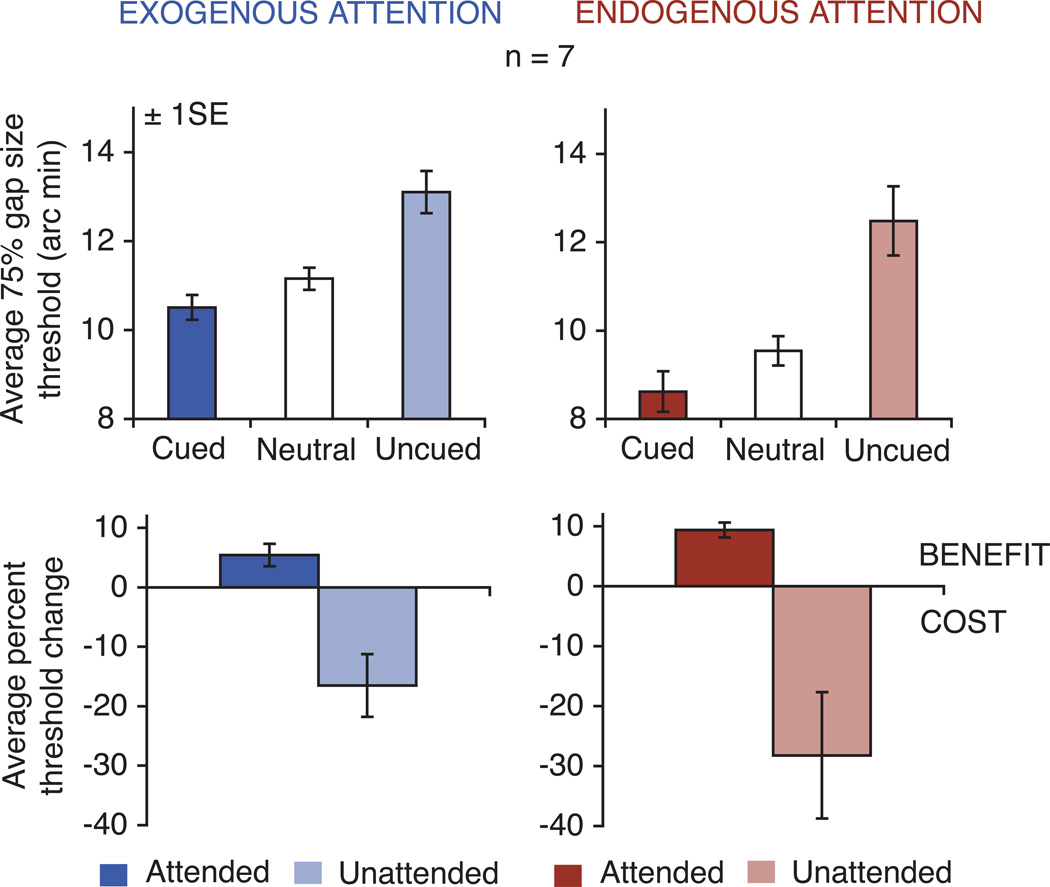
Figure 3.
Attention and spatial acuity. Average gap-size thresholds (75% localization accuracy) for both exogenous (upper left panel) and endogenous (upper right panel) attention for the cued, neutral, and uncued conditions. The lower panels depict the average percent change in acuity thresholds at cued and uncued locations as compared to the neutral condition for exogenous (left) and endogenous (right) attention. Values below zero indicate a cost in acuity, whereas values above zero indicate a benefit. Error bars show ± 1 SE.

