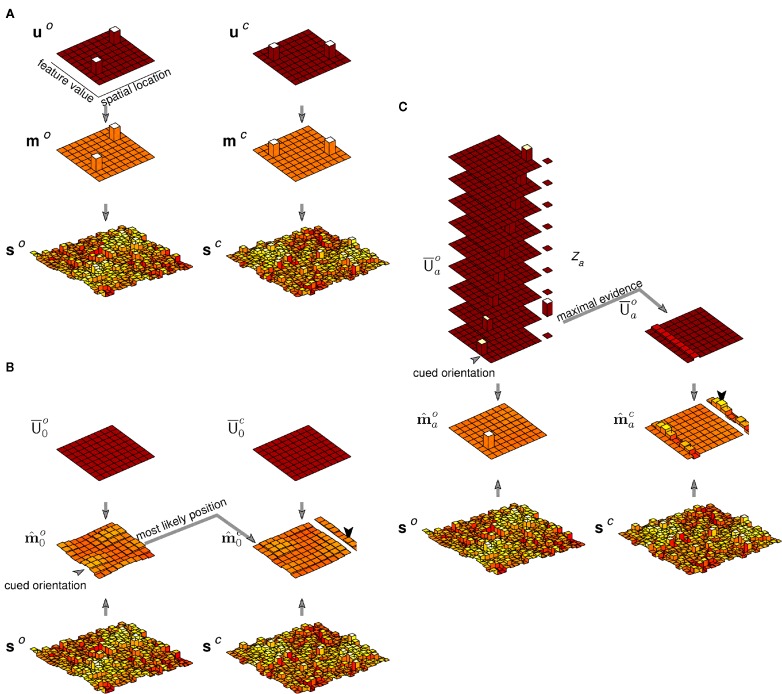
Figure 6.
Generation, inference, and decision in a model of binding. (A) Generation. Two non-zero entries in each of uo, uc, mo, and mc represent the two oriented, colored bars. Each yields a smeared and noisy bump of activity in the sensory cue maps so and sc. (B) Inference and decision without attention. The mean posterior maps and are obtained from the generated sensory cue maps so and sc under non-specific priors (shown as in Figure 4 by the diagonal elements of rearranged into a map). The maximum strength value in at the cued orientation selects a location. The maximum strength value in at this location determines the reported color. Noise in the inferred feature maps leads to an error in the example shown. (C) Inference and decision with attention. The evidence Za is evaluated for each hypothesis corresponding to an object at different positions with the cued orientation, depicted by the stack of possible priors. The mean posterior maps and are obtained under the attentional hypothesis with greatest evidence. The mean color map is then summed over space, and the maximum strength value determines the reported color. This process recovers the correct binding with exactly the same instantiation of sensory activity as in (B).

