Figure 1.

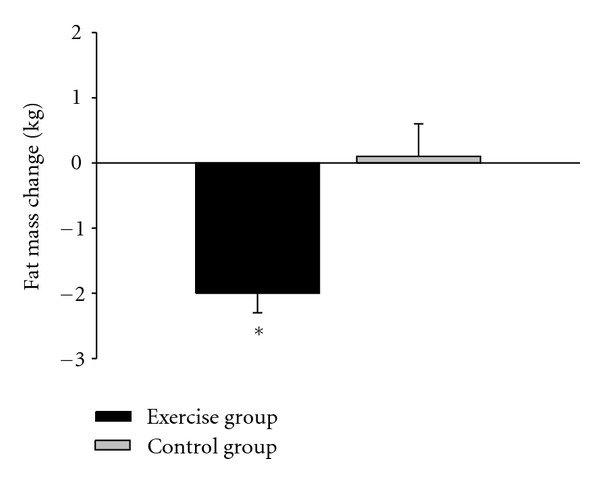
Total fat change for the high-intensity intermittent exercise and no exercise control groups (N = 38, mean and standard error). *Significantly different from control group (P < 0.05).

Total fat change for the high-intensity intermittent exercise and no exercise control groups (N = 38, mean and standard error). *Significantly different from control group (P < 0.05).