
Figure 2.
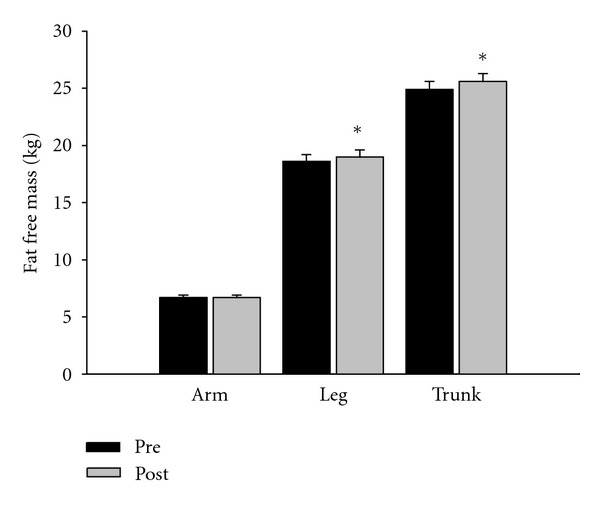
Fat-free mass change for the high-intensity intermittent exercise groups (N = 38; mean and standard error). *Significant difference between pre- and posttesting (P < 0.05).
Official websites use .gov
A
.gov website belongs to an official
government organization in the United States.
Secure .gov websites use HTTPS
A lock (
) or https:// means you've safely
connected to the .gov website. Share sensitive
information only on official, secure websites.
Fat-free mass change for the high-intensity intermittent exercise groups (N = 38; mean and standard error). *Significant difference between pre- and posttesting (P < 0.05).