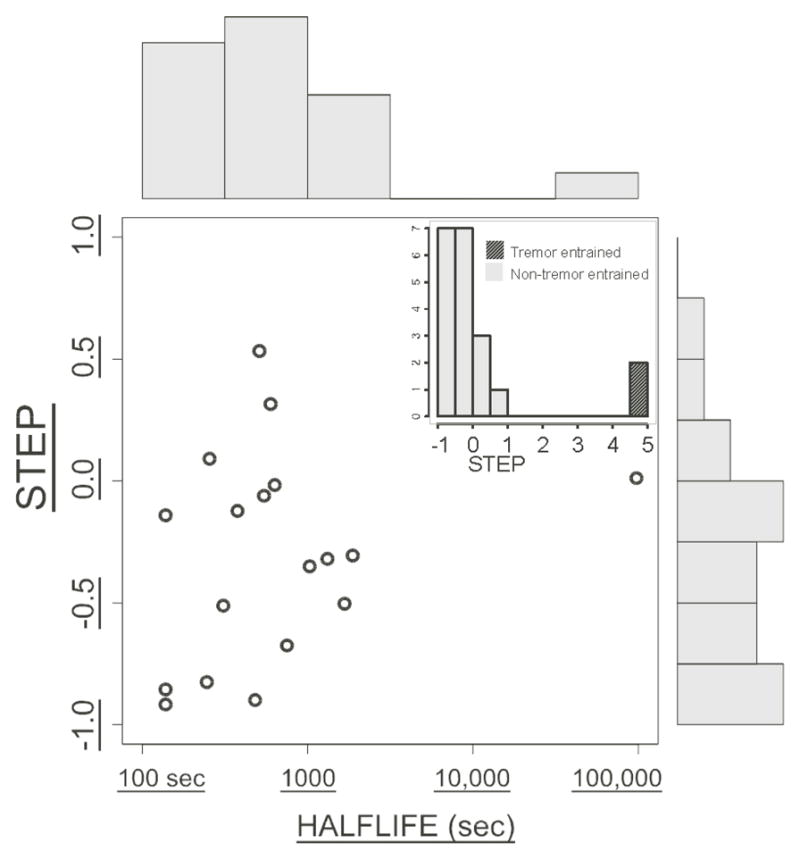
Figure 2.

“STEP” parameter vs. HALFLIFE (semilog axis). N = 20 subjects. Histograms of STEP and HALFLIFE are shown along the vertical and horizontal axes, respectively, for non-tremor-entrained subjects (tremor entrained subjects shown in the inset).
