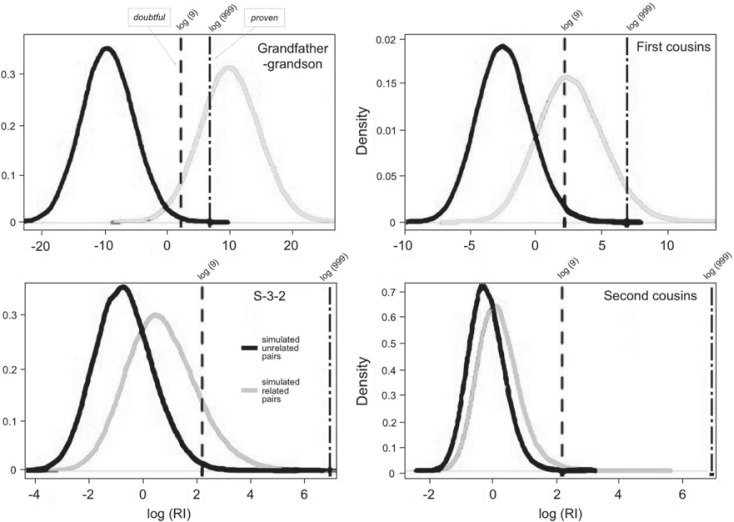
Fig. 5.
Density distributions of log RI values obtained from 100,000 simulations each of unrelated (black distributions) and related pairs (grey), for four different pairwise relationships. Reference lines of log 9 and log 999 represent doubtful and proven relationship likelihood thresholds respectively. The closest related pairs of grandfather-grandson show almost fully separated distributions with nearly all unrelated pairs less than doubtful and a large majority of related pairs more than proven. This pattern is progressively eroded as the related pairs become more distant, till the second cousin pairs’ distributions are near identical to unrelated pairs showing almost no pairs higher than doubtful.

