Figure 1.
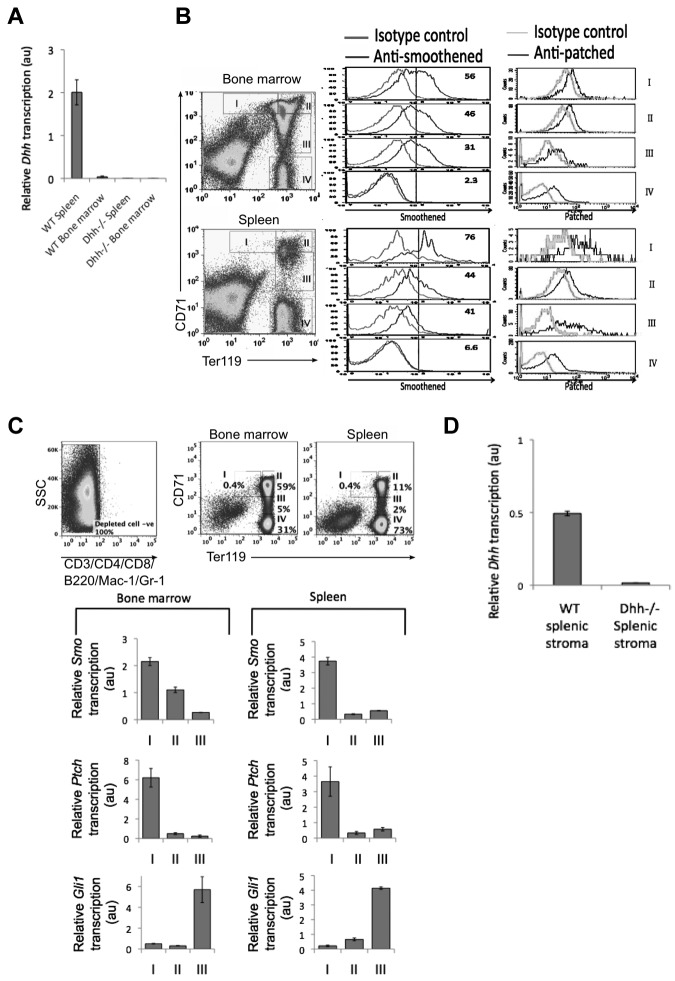
Components of the Hh pathway are expressed in erythroblasts in spleen and BM. (A) Quantitative RT-PCR of Dhh expression in WT and Dhh−/− spleen and bone marrow. (B) Histograms represent anti-Smo staining (left column) and anti-Ptch staining (right column), gated on erythroblast populations I to IV, as defined by Ter119 and CD71 expression (dot plots). Top panel represents WT BM; and bottom panel, WT spleen. (C) Quantitative RT-PCR analysis in sorted erythroblast populations I to III from WT BM. Dot plots represent sorting strategy. Cells were first magnetic bead–depleted to remove lymphocyte, macrophage, and granulocyte populations, and the negative populations (negative for CD3, CD4, CD8, B220, Mac-1, and Gr-1, left dot plot) were then stained with anti-CD71 and anti-Ter1119. Gates used for sorting are shown for BM (middle dot plot) and spleen (right dot plot). Bar charts represent Smo, Ptch, and Gli1 expression in BM (left) and spleen (right). (D) Quantitative RT-PCR of Dhh expression in WT and Dhh−/− splenic stroma.

