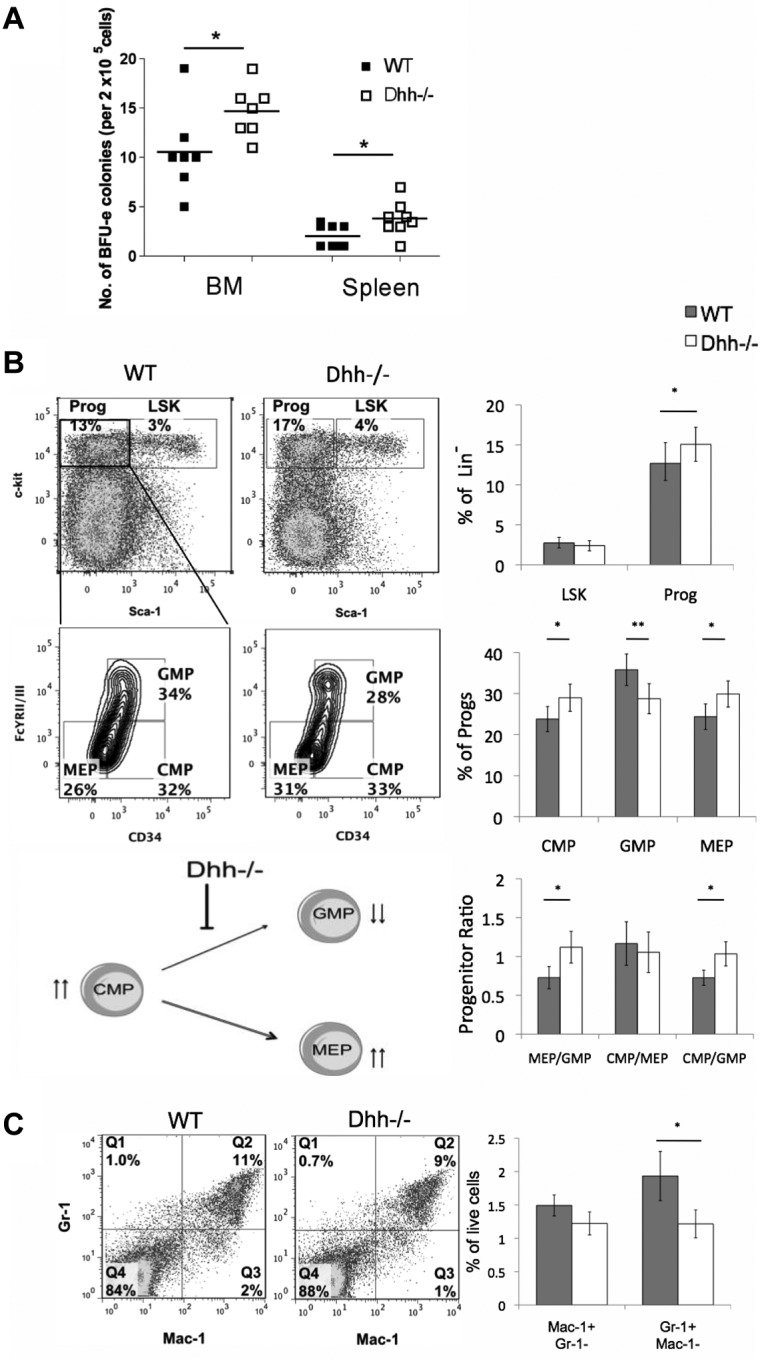
Figure 4.

Dhh influences early erythropoiesis and progenitor differentiation. (A) Scatter plot represents BFU assays, carried out on BM and spleen, from WT (filled squares) and Dhh−/− (open squares). The mean for each group is indicated with a line. The increase in mean number of colonies in Dhh−/− compared with WT is statistically significant for both BM (P = .050) and spleen (P = .032). (B) Dot plots represent analysis of LSK stem cells and Sca-1−c-kit+ progenitors in WT (left) and Dhh−/− (right) BM, staining with antibodies against Sca-1 and c-kit, after exclusion of Lin+ cells. The bold region represents the gating used to analyze the Sca-1− c-kit+ progenitor population. Contour plots represent the subdivision of the progenitor population from WT (left) and Dhh−/− (right), staining against CD34 and FcγRII/III, into CMP, GMP, and MEP. The percentage of progenitors in each subset and the regions used for their definition are shown. Top bar chart represents the mean percentage of Lin− cells that are LSK (Sca-1+ c-kit+) and progenitor (Sca-1−c-kit+) in WT (filled bars) and Dhh−/− (open bars) BM. The increase in the mean percentage of progenitors in the Dhh−/− compared with WT is statistically significant (P = .019). Middle bar chart represents the percentage of the progenitor population that is CMP, GMP, or MEP, as defined by CD34 and FcγRII/III expression, in WT (filled bars) and Dhh−/− (open bars). The difference in mean proportion is statistically significant between WT and Dhh−/− for CMP (P = .05), GMP (P = .0006), and MEP (P = .005). Bottom bar chart represents the mean progenitor ratio in WT (filled bars) and Dhh−/− (open bars). The difference in mean ratios between WT and Dhh−/− is statistically significant for MEP/GMP (P = .009) and CMP/GMP (P = .024), but not for CMP/MEP. The cartoon represents a summary of the effects of Dhh deficiency at this stage of differentiation. Absence of Dhh, reduced differentiation from CMP to GMP, and the GMP population are reduced. The CMP population is increased, and differentiation to MEP is favored. (C) Dot plot represents staining against Gr-1 and Mac-1 on BM cells from WT (left) and Dhh−/− (right). The percentage of cells in each quadrant is shown. Bar chart represents the mean percentage of BM cells that are macrophages (Mac-1+Gr-1−) and granulocytes (Mac-1−Gr-1+) in WT (filled bars) and Dhh−/− (open bars). The reduction in the mean percentage of granulocytes in Dhh−/− compared with WT is statistically significant (P = .04).
