Figure 5.
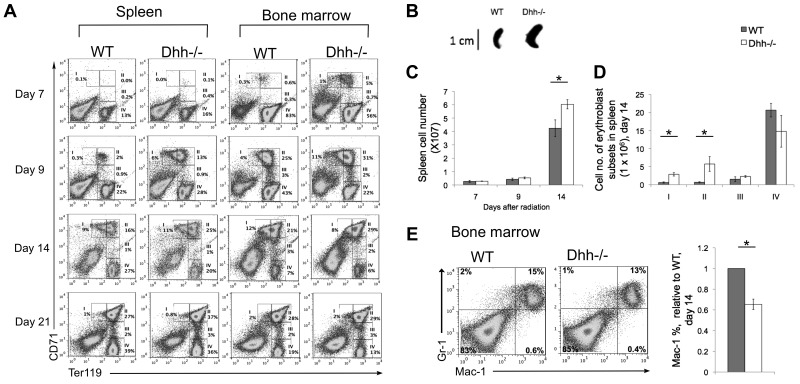
Acceleration of differentiation and recovery after irradiation in Dhh−/− mice. (A) Kinetics of recovery of the erythroblast populations after nonlethal irradiation was measured in the spleen (left panel) and BM (right panel) at 7 days (top row), 9 days (second row), 14 days (third row), and 21 days (fourth row) after irradiation. Dot plots represent erythroblast populations I to IV, defined by CD71 and Ter119 expression, and the regions used and percentage of cells in each population are shown. (B) Photograph represents typical spleen from WT (left) and Dhh−/− (right) at 14 days after irradiation. (C) Bar chart represents the mean spleen cell number after irradiation in WT (filled bars) and Dhh−/− (open bars). The increase in mean cell number in Dhh−/− compared with WT on day 14 is statistically significant (P = .046). (D) Bar chart represents the mean number of cells in each erythroblast subset in WT (filled bars) and Dhh−/− (open bars) in the spleen on day 14. The difference in mean between WT and Dhh−/− was statistically significant for population I (P = .003) and population II (P = .044). (E) Dot plot represents staining against Mac-1 and Gr-1 on day 14 after irradiation from WT (left plot) and Dhh−/− (right plot) BM. Bar chart represents the mean relative percentage of Mac1+ cells in WT (filled bars) and Dhh−/− (open bars) BM, 14 days after irradiation. The difference in mean relative percentage is statistically significant (P < .001).

