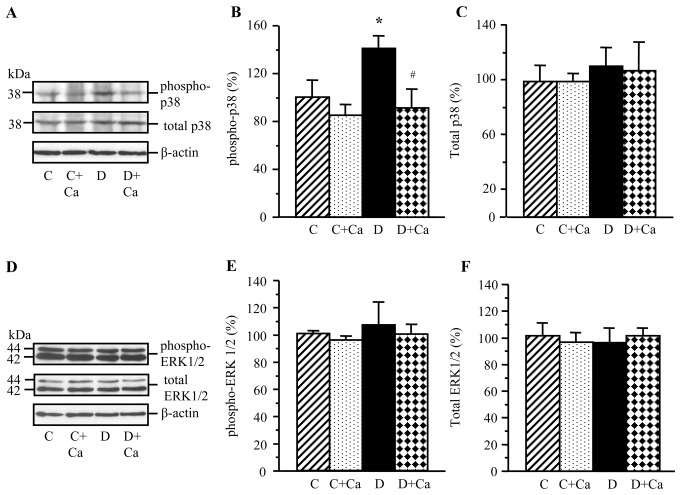
Figure 4.
Representative western blot analyses of (A) phosphorylated and total p38 mitogen-activated protein kinase and (D) phosphorylated and total extracellular signal-regulated kinase, and protein contents (densitometry) of (B and C) phosphorylated and total p38 mitogen-activated protein kinase and (E and F) phosphorylated and total extracellular signal-regulated kinase in the lens of control and diabetic rats maintained with or without cariporide treatment. C, control group; D, diabetic group; Ca, cariporide; MAPK, mitogen-activated protein kinase; ERK, extracellular signal-regulated kinase. Mean ± SEM, n=6/group. *P<0.05 vs. the controls; #P<0.05 vs. the untreated diabetic group.

