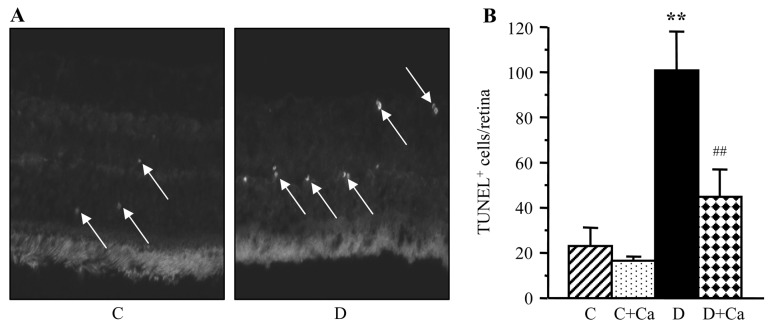
Figure 5.
(A) Representative microphotographs of TUNEL-positive cells (TUNEL fluorescence is shown by arrows) in the retinal sections of control and diabetic rats. Magnification, ×40. (B) TUNEL-positive cell counts per flat-mounted retina in control and diabetic rats maintained with and without cariporide treatment. C, control group; D, diabetic group; Ca, cariporide. Mean ± SEM, n=10/group. **P<0.01 vs. the controls; ##P<0.01 vs. the untreated diabetic group.

