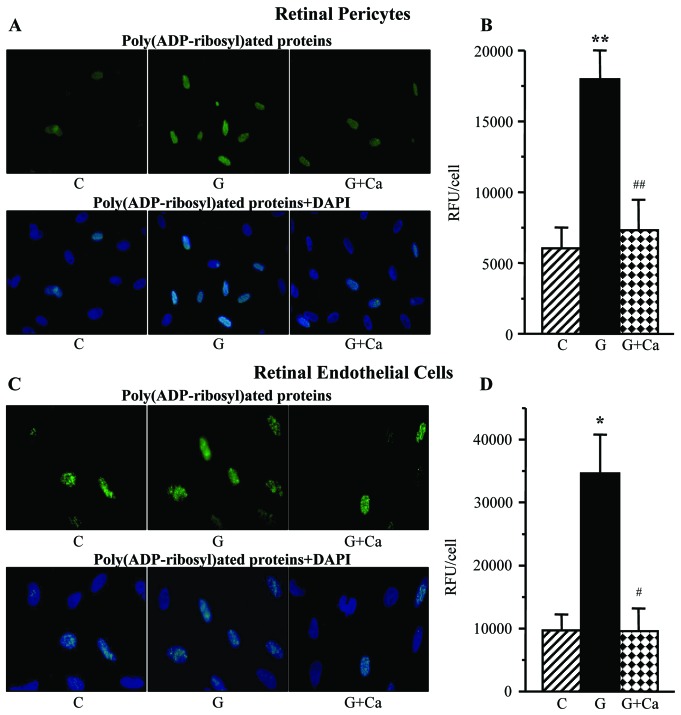
Figure 8.
Left, representative microphotographs of poly(ADP-ribose) fluorescence (green) in (A) retinal pericytes and (C) endothelial cell cultures maintained for 7 days i) with 5 mM glucose and without 10 μM cariporide; ii) with 30 mM glucose and without 10 μM cariporide; and iii) with 30 mM glucose and 10 μM cariporide. Magnification, ×100. Blue fluorescence corresponds to 4′,6-diamidino-2-phenylindole-stained nuclei. Right, poly(ADP-ribose) fluorescence (relative fluorescence units/cell) in (B) retinal pericyte and (D) endothelial cell cultures maintained as described above. C, control group (5 mM glucose); G, 30 mM glucose; Ca, cariporide; RFU, relative fluorescence units. n=5–8/group. *P<0.05 and **P<0.01 vs. cells cultured in 5 mM glucose; #P<0.05 and ##P<0.01 vs. cells cultured in 30 mM glucose without 10 μM cariporide.

