
Figure 5.
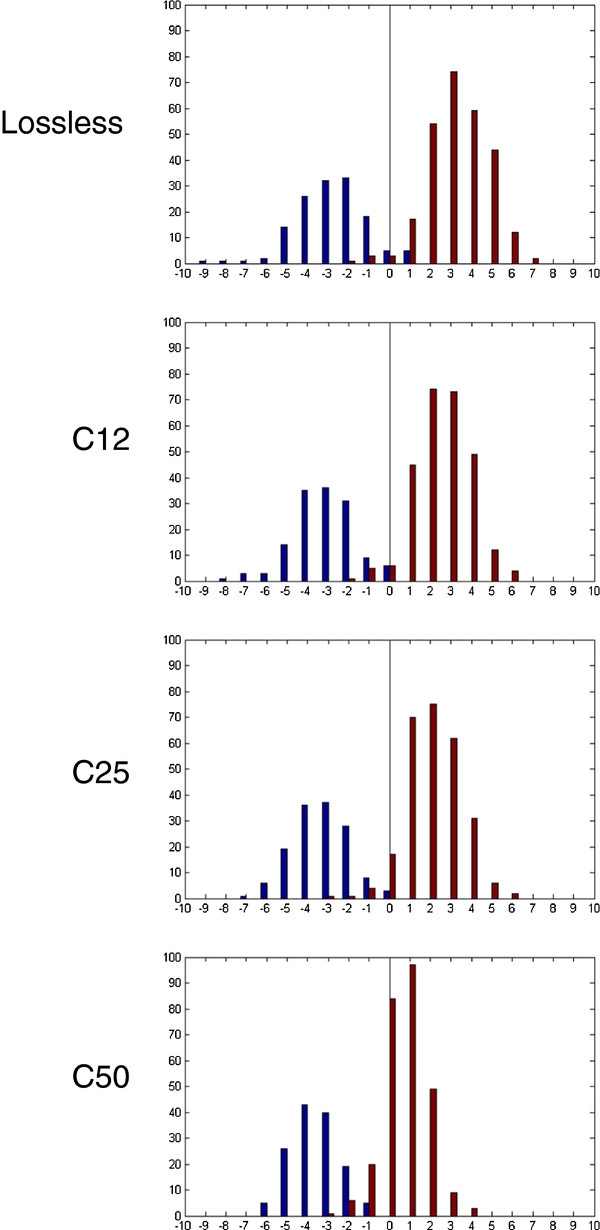
Histograms of automated tumor segmentation scores (blue denotes stromal and red colorectal cancer epithelial images as determined by visual assessment; negative x-axis values correspond to stroma and positive values to epithelium by decision of automated method).