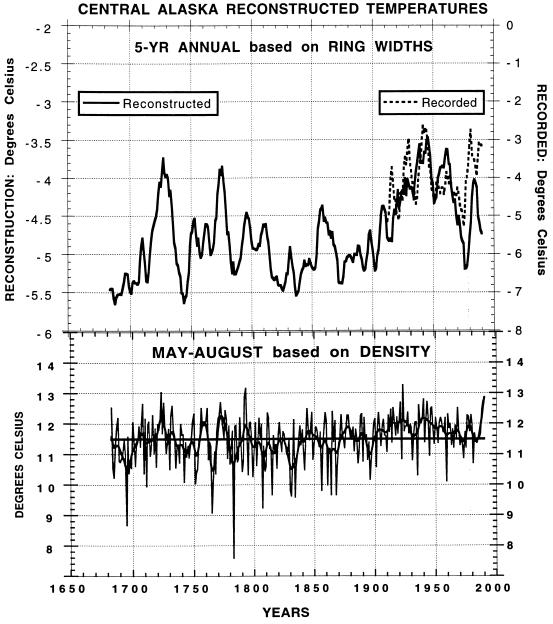
Figure 1.
Reconstructions of central Alaska temperatures. (Upper) Five-year averaged annual (October–September) temperature reconstructed by using ring widths. (Lower) Summer (May–August) temperatures reconstructed by using maximum latewood density. Note the increase in reconstructed summer temperature over the past 100 years is only about 0.5° to 1.0°C, whereas the reconstructed annual temperature has increased about 1.5° to 2°C. The cooler period in annual temperatures prior to 1900 was broken by several warm intervals. Dashed line in Upper is 5-year recorded temperatures for central Alaska. Note that the reconstruction underestimates temperatures since about 1970. This is attributed to the effects of moisture stress (8).

