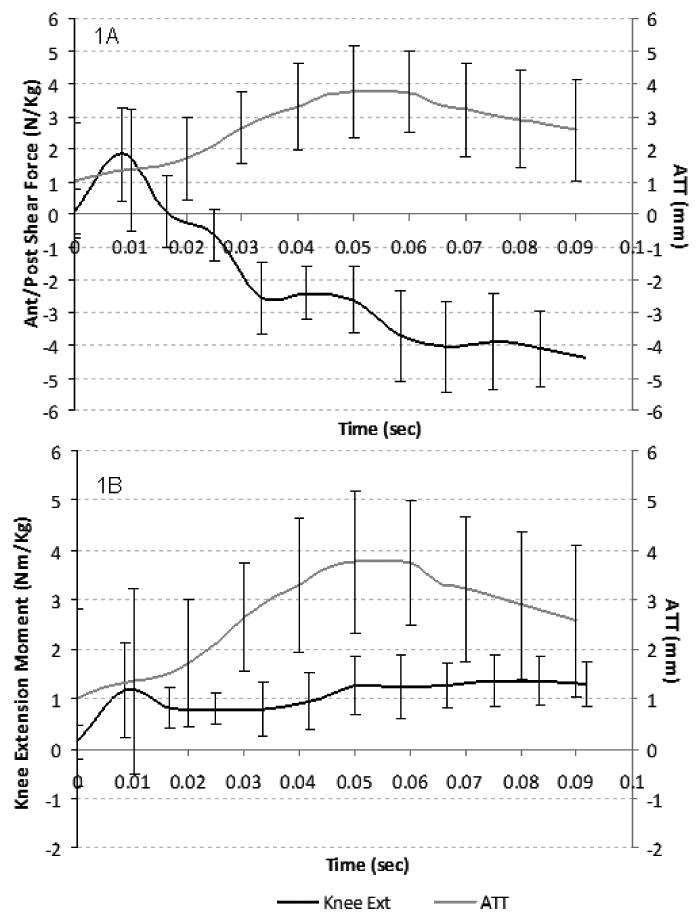
FIGURE 1.

(1A): Time series plot of ATT (grey line) derived from fluoroscopy and knee shear force estimated from the motion capture system and the inverse dynamics process (black line). Positive values represent an anteriorly directed shear force. (1B) Time series plot of ATT derived from fluoroscopy (grey line) and the external knee extensor torque curve estimated from the motion capture system and the inverse dynamics process (black line). Positive torque values represent external knee extensor torque values. Deviations depicted in both time series data sets represent +/- 1 SD from the mean.
