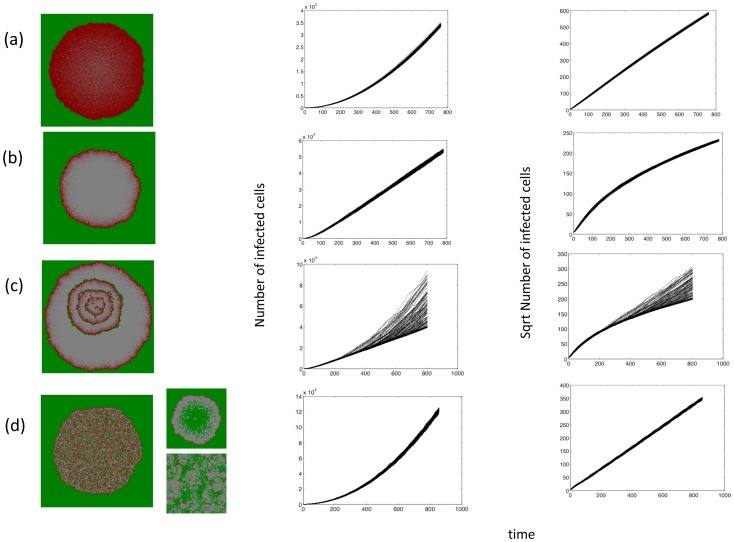
Figure 2. Initial virus growth dynamics in the agent-based model.
Each row represents one case, characterized by a certain parameter combination. The left graph shows the spatial pattern. Green indicates uninfected cells, red infected cells, and grey empty spots. The middle graph shows the number of infected cells over time. The different lines represents 100 different instances of the simulation with the same parameter combination. The right graph shows the square root of the number of infected cells over time, again showing lines for 100 different runs. If this graph is linear, we observe quadratic or “surface” growth. Two basic types of initial growth are observed. Cases (a) and (b) show the formation of a ring structure, characterized by an initial phase of quadratic growth, and a subsequent phase of linear growth. In (a) the death rate of infected cells is lower, thus requiring a longer period of time until a hollow ring is formed. Hence, the duration of the quadratic growth phase is relatively long, almost the entire duration of the simulation presented here. Eventually, however, it will transition to linear growth, as exhibited in case (b), characterized by a faster death rate of infected cells. Case (d) shows a disperse growth law. No ring structure is formed. The virus population leaves behind susceptible cells, thus leading to a mixed pattern and quadratic growth. The small graphs depict a variation of this outcome which occurs if the viral spread rate is at the low end of the spectrum. Due to a higher number of target cells at the edge of the infection area, significant number of infected cells are only found there, and we observe a ring-like structure with a mass of uninfected cells in the center (upper small graph). Over time, the dynamics develop into a mixed pattern with low levels of infected cells (lower small graph), or the infection goes extinct. Case (c) lies in between the hollow ring and the mixed pattern. Initially a ring structure is formed, resulting first in quadratic, then in linear growth. However, on rare occasions uninfected cells remain in the wake of the expanding virus population, thus leading to concentric rings. While this does not happen in all instances of the simulations, when it does occur, the growth law transitions back from linear to quadratic. Parameter values were chosen as follows. (a) R = 0.5; D = 0; B = 0.6; A = 0.601. (b) R = 0.5; D = 0; B = 0.6; A = 0.62. (c) R = 0.5; D = 0; B = 0.6; A = 0.628. (d) R = 0.5; D = 0; B = 0.6; A = 0.7. The small graphs in (d) are characterized by R = 0.04, leading to fewer target cells in the area of infection and thus to slower viral spread.

