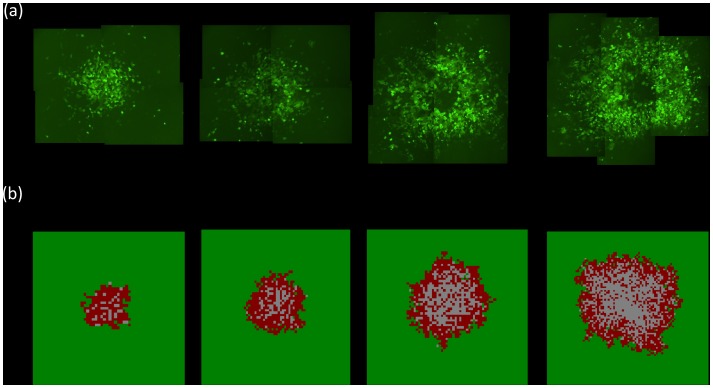
Figure 4. Observed (a) and predicted (b) spatial pattern of adenovirus (AdEGFPuci) growth for the experiment that exhibits a ring structure (time series given in Figure 3a).
The predicted spatial pattern is the result of an individual run of the agent-based model with the parameter combination obtained from the model fitting procedure. Snapshots in time are shown, representing days 7, 9, 11, and 13 post infection. (a) The area of green fluorescence is shown, expressed by the infected cells, thus documenting the spatial spread of the virus through the population target cells arranged in a two dimensional setting. (b) In the computer simulation, green indicates infected cells, red infected cells, and grey empty spots.

