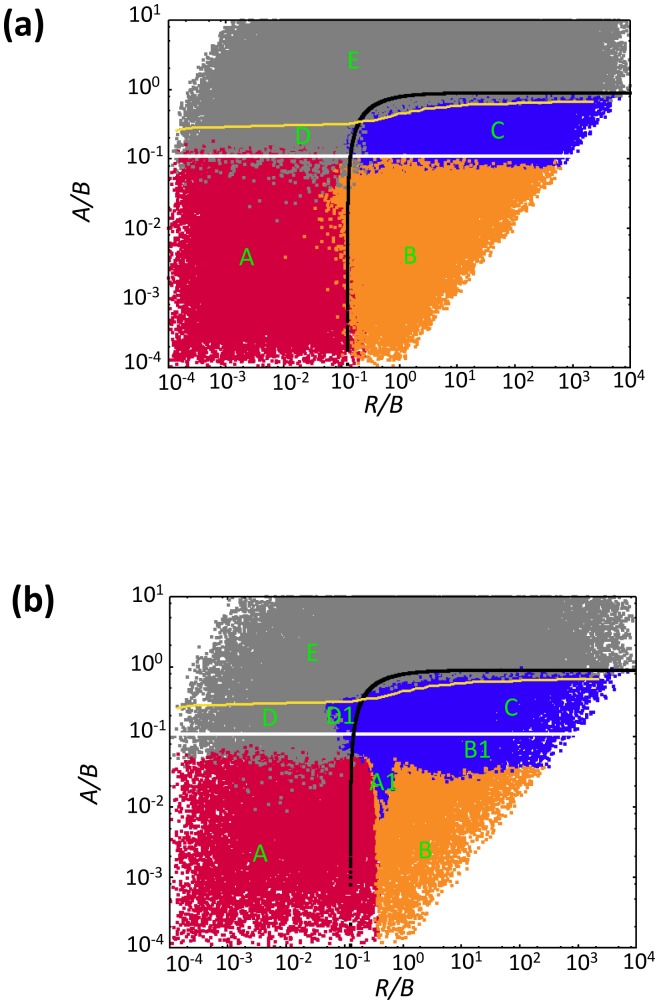
Figure 6. Dependence of outcomes on parameters in the agent-based model for (a) a relatively small 30×30 grid, and (b) a relatively large 300×300 grid.
The plot is the result of at least 104 instances of the simulations, where the log10 of the parameters was varied between −4 and 4. The simulations were started by placing a small number of infected cells (5×5 cells) into a larger space filled with infected cells (13×13 cells). Identical results were observed over a very large range of initial conditions (differences were only observed if the initial number of cells is such that immediate stochastic extinction is likely, which are not regions of interest with respect to our study). Blue indicates coexistence of virus and cells. Red and orange indicate extinction of the cells and thus the virus. Red is used if extinction occurs before the boundary of the system has been reached, while orange is used if extinction occurs after cells have reached the boundary of the system. Grey indicates extinction of the virus while cells persist. Above the white line and below the black line, the “local” equilibrium number of uninfected and infected cells, respectively, is greater than one. This derives from ordinary differential equations that describe the dynamics within local neighborhoods where all cells can interact with each other (see Text S1). Below the yellow line, the virus can successfully invade its target cell population. This invasion threshold was determined by numerical simulations. The capital letters indicate different spatial patterns that are described in the text and in Figure 7. In these simulations, the probability for an uninfected cell to die was kept constant at D = 0.

