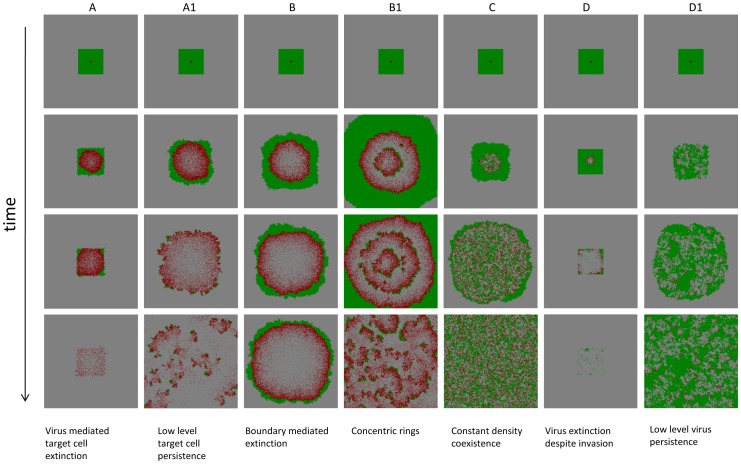
Figure 7. Seven spatial patterns observed in the agent-based model.
For each pattern, four snapshots in time are shown. Green indicates uninfected cells, red infected cells, and grey empty patches. See corresponding capital letters in Figure 6, showing in which parameter regions the individual patterns are observed. The time series that are associated with the individual patterns are shown in Figure 8. See text for details. The simulations were run on a 300×300 grid. The simulations were started by placing a small number of infected cells (5×5 cells) into a larger space filled with infected cells (13×13 cells). Parameters were chosen as follows: (A) R = 0.013; D = 0; B = 0.14; A = 0.003; (A1) R = 0.15; D = 0; B = 0.32; A = 0.007; (B) R = 0.014; D = 0; B = 0.015; A = 0.00056; (B1) R = 0.04; D = 0; B = 0.032; A = 0.0016; (C) R = 0.014; D = 0; B = 0.032 ; A = 0.008; (D) R = 0.0002 ; D = 0; B = 0.019 ; A = 0.0032 ; (D1) R = 0.069 ; D = 0; B = 0.64 ; A = 0.18.

