
Figure 5. Orientation discrimination using single cell spike latencies and firing rates.
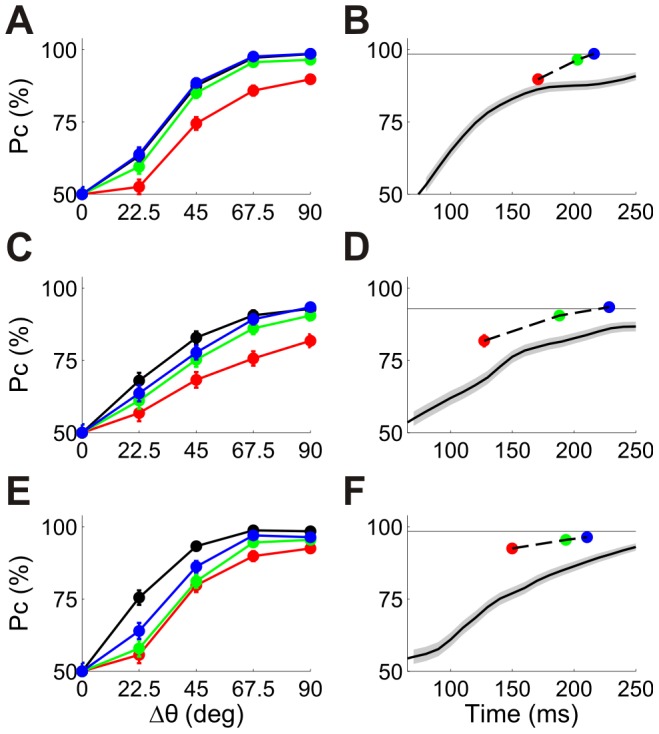
(A) Neurometric curves for a single cell using the first spike latency (red), second spike latency (green), third spike latency (blue) and the firing rate (black). These curves represent the probability of correct discrimination in a 2AFC paradigm where one stimulus is at the cell's preferred orientation, PO, and the other at PO±Δθ. (Error bars represent the standard error of the mean, but are often smaller than the marker size). (B) Neurometric curves for 90° discrimination as a function of decision time. The black curve represents probability of correct discrimination based on firing rate for different time windows starting at stimulus onset (the curve starts at 60 ms because deviation from spontaneous activity starts at about this time). (The gray band represents ± standard error of the mean). The horizontal line represents the asymptotic performance using firing rate from the full response (black circle at 90° in A). The filled circles represent decisions using first, second and third spike latencies with the same color code as in (A) (error bars are smaller than the marker size). Each circle is plotted at the corresponding mean decision time. This cell was taken from dataset 1 in Table 1. (C)–(F) The same as (A) and (B) for two other cells from dataset 5 in Table 1. (The 3 cells in this figure are the same cells as in Figure 2).