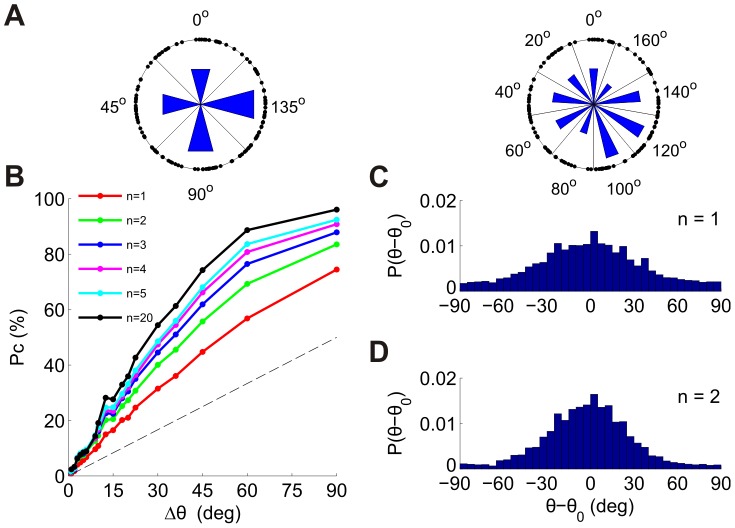
Figure 9. Discrimination among multiple alternatives using the n-tWTA in populations of neurons.
(A) The tuned neurons in one of the datasets (dataset 3 in Table 1) were divided according to their preferred orientations into M groups of equal orientation width, Δθ = 180°/M. To illustrate this division, each point on the circle represents a neuron (the angle is twice the preferred orientation). The left plot illustrates division into M = 4 groups of width Δθ = 45° and the right plot illustrates division into M = 9 groups of width Δθ = 20°. Each group is labeled by the orientation of its center. The lengths of the blue bars are proportional to the number of neurons in each group. (B) Probability of correct discrimination of the n-tWTA as a function of group width. The different curves correspond to n = 1,2,3,4,5 and 20. (C–D) Distribution of errors for group width of Δθ = 1° for n = 1 (C) and n = 2 (D).

